Tracking QR codes provides valuable insights into audience engagement, the success of marketing activities, and the opportunity to optimize your strategy based on data. In this article, we will look at why QR campaign analytics is essential. We will provide 15 best practices for tracking and optimizing QR codes, identify key metrics to monitor, and show you how to improve results based on this data.
Why QR Campaign Analytics are Important
Tracking QR code performance allows marketers to act on data, not guesswork. Here are a few reasons why QR campaign analytics matter:
- Eliminate uncertainty: Scan data takes the guesswork out of campaign success and helps you make informed decisions instead of guesswork. You know exactly how many people scanned the code and how they interacted with the content.
- Test and improve: Analytics allow you to test different elements of your ad, such as QR code design, call-to-action, placement, and see what resonates best with your audience. For example, you can compare which of two versions of a QR code poster gets more scans or conversions and focus on the more effective one.
- Understand your audience: Analyzing scan data gives you insights into your audience. Where, when, and from which devices they scan, and what language they use. This helps you adjust your marketing tactics to meet consumer preferences. For example, knowing the cities where QR codes were scanned most often allows you to target more resources to those regions or adapt your content to local needs.
So, QR analytics transforms a traditional print or offline campaign into a data-driven one. You can measure the impact of QR codes on traffic, engagement, and conversions, and prove the return on investment (ROI) to your management. Now, let’s move on to specific practical tips on how to track and optimize QR campaigns.
15 Best Practices for Tracking and Optimizing QR Campaigns
Below are fifteen proven practices that will help you properly track QR code performance and optimize your campaigns based on the analytics you get. Each tip includes a description of the metrics you should measure and an example of how to use them in a real-world scenario.
1. Use Dynamic QR Codes Instead of Static Ones
| Feature | Static QR Code | Dynamic QR Code |
|---|---|---|
| Editability | ❌ Not editable after printing | ✅ Can be edited anytime |
| Tracking capability | ❌ No tracking | ✅ Full analytics (time, location, device) |
| Ideal for | Simple, permanent links (e.g., Wi-Fi) | Marketing, campaigns, multi-use content |
| URL length impact | Directly affects code density | Uses short redirect links |
| Best use case | One-off access (e.g., PDF menu) | Campaigns, A/B testing, CTA landing pages |
Start by choosing dynamic QR codes for your campaigns. Static QR codes are encoded once and for all and do not allow you to track scans, as the information (URL) is hard-coded into the code. Instead, dynamic QR codes redirect to a URL via a dedicated server, which allows you to collect analytics for each scan. Dynamic codes can be modified and their target content updated even after printing, without changing the code itself. This is ideal for marketing: you can fix links or content on the fly without having to re-release materials.
Metric:
Total scans, unique scans. The dynamic QR system automatically counts these metrics. Total scans show the full volume of interactions (across all scans), while unique scans filter out repeats and only count unique users or devices. The ratio of these metrics will tell you how many people are rescanning the code. For example, suppose total scans significantly outnumber unique scans. In that case, some of the audience members are returning to the QR code multiple times.
Example:
A company launched an advertising campaign with a dynamic QR code on billboards. In one month, they recorded 10,000 scans, of which 8,000 were unique. This meant that approximately 20% of the scans were repeat interactions, meaning some users scanned the code more than once (perhaps sharing with colleagues or returning to the offer). With the dynamic QR code, the team received this data in real time and was able to measure audience engagement. If they used static code, they would only know the number of clicks to the site. Still, they would not have flexible analytics and the ability to change the destination link after the campaign has started.
2. Choose a Reliable Platform with QR Code Analytics
To effectively track, you need a reliable tool. Choose a QR code generation service that provides advanced scan analytics. Make sure the platform supports dynamic QR codes and allows for the collection of scan data: time, location, device type, and other details. For example, modern services like ViralQR allow marketers to track detailed scan parameters. You can track the device model and operating system to the city where the code was scanned, and even the language installed on the user’s phone. Such granularity helps to understand your audience more deeply.
Metrics:
Various scan indicators (time, geography, device, etc.). A good platform will collect all key metrics automatically (see the “Key Metrics to Monitor” section below). Your job is to make sure the data is accurate and complete.
Example:
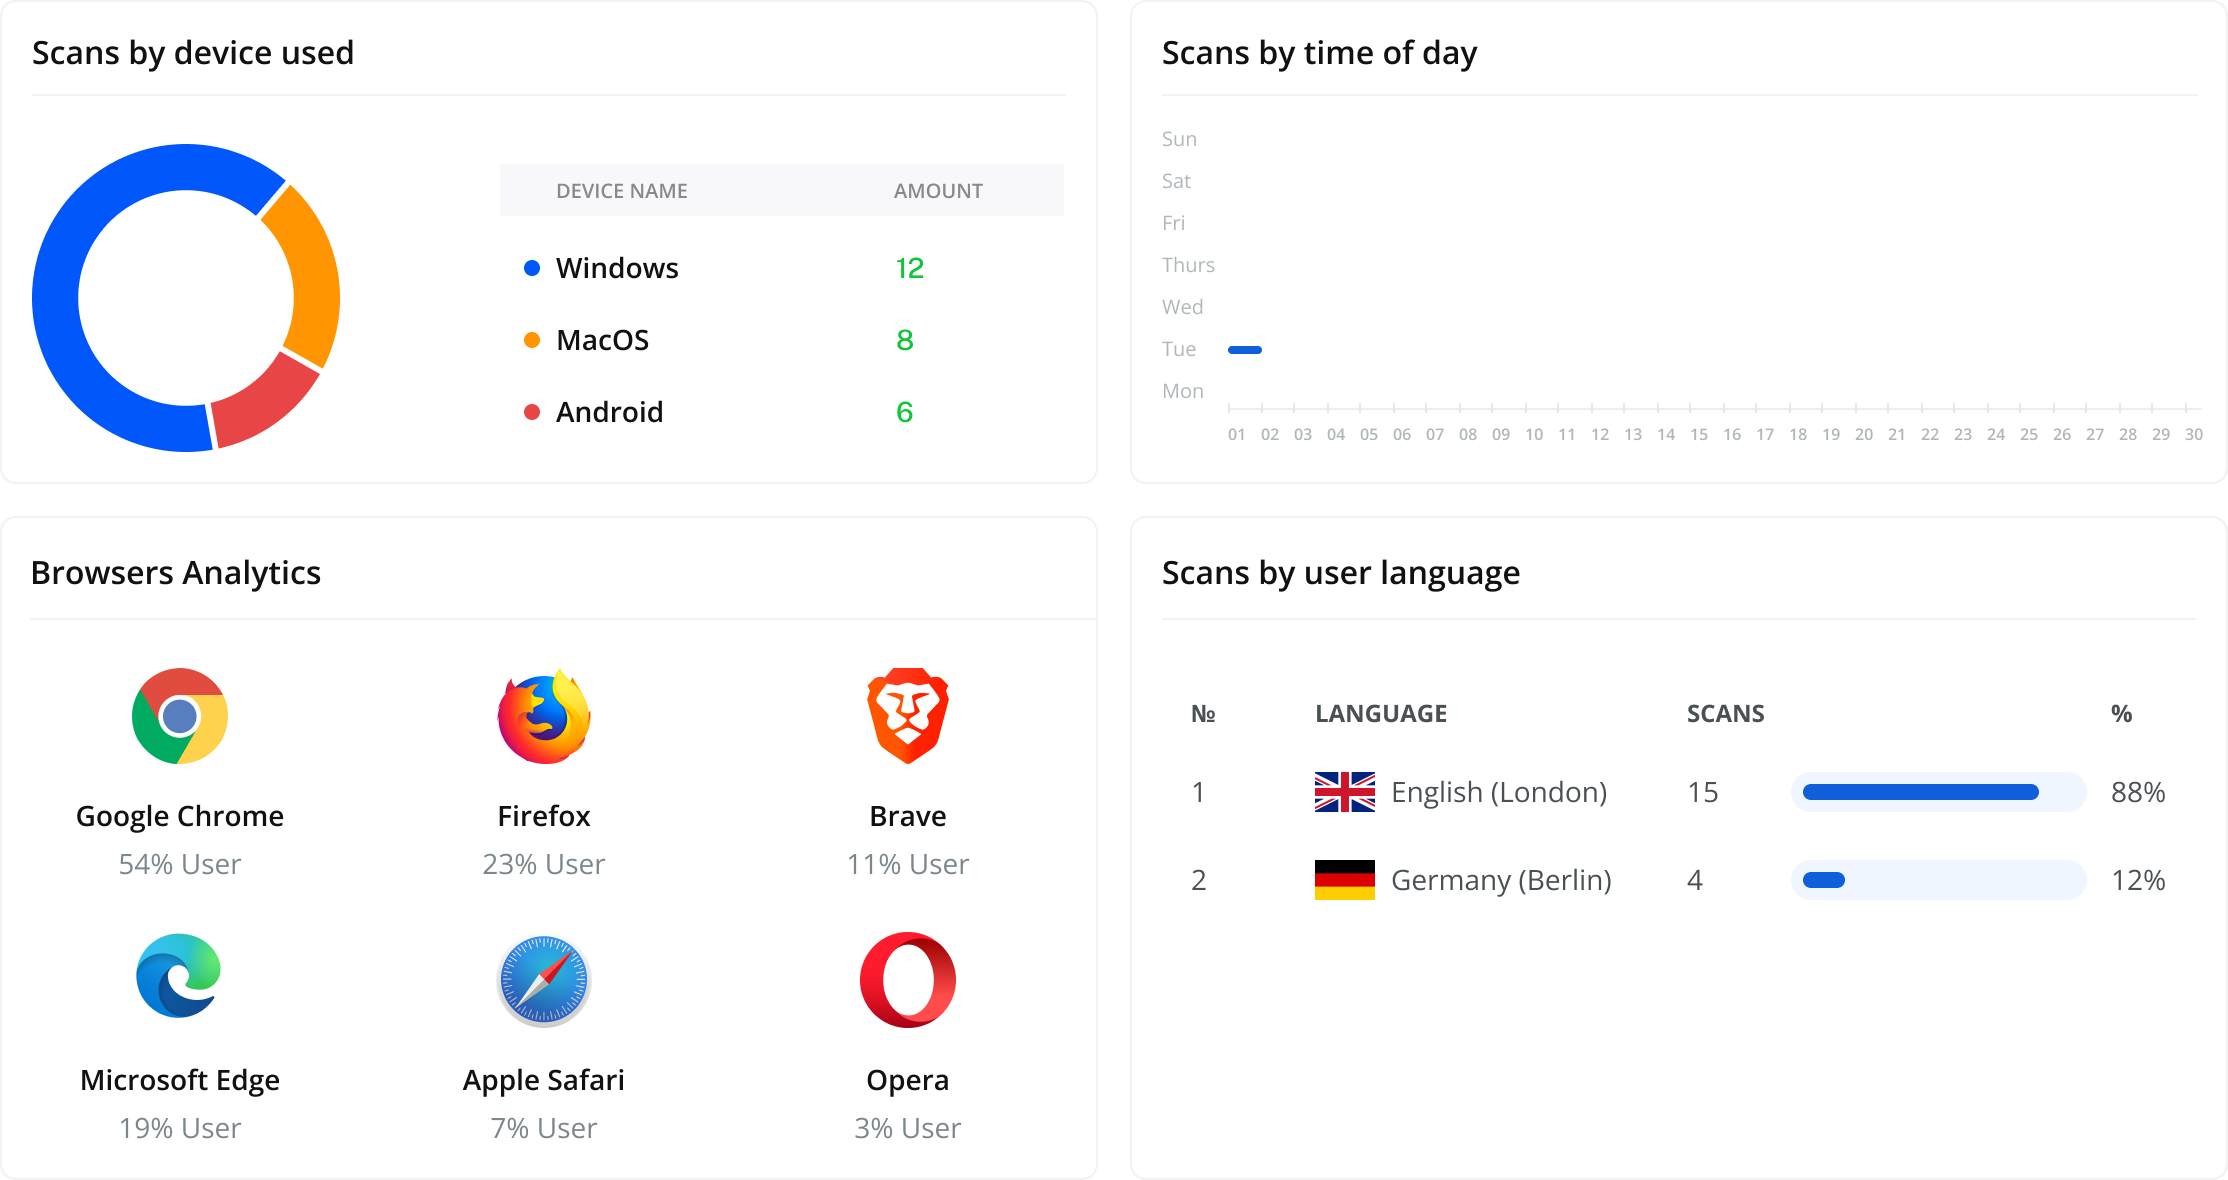
A marketing team chose ViralQR for their B2B trade show campaigns. Their dashboard showed in real time what devices visitors were using (60% of scans were from Android smartphones, 40% from iPhones), which cities were the most active in scanning (for example, Los Angeles and Chicago were the leaders), and what language the scanners’ phones were set to (80% English, 15% Spanish, 5% other). This information allowed the team to customize their content, adding a Spanish-language version of the landing page and ensuring that the site displayed correctly on popular Android screen sizes.
3. Set Clear Goals and KPIs Before You Launch Your Campaign
Description: Before you start distributing QR codes, define what results you expect. Clear goals will help you focus on the right metrics. For example, your goal is to attract 500 visitors to your website, receive 50 applications, or ensure 100 app downloads via a QR code. The goals will determine which metrics to focus on: conversions, time on site, number of new users, etc. Set KPIs (key performance indicators) for your QR campaign – these can be the number of scans, the percentage of conversions after a scan, the rescan rate, or the engagement rate (for example, the proportion of those who scanned the code out of all those who saw it).
Metric:
Depends on the goal. If the goal is traffic, the main metric is the number of scans. If the goal is leads, then conversions (completed forms, downloads, etc.). Time spent on the page after a scan can be important for brand engagement. By defining KPIs, you will track the metrics that reflect your goals.
Example:
Before launching a campaign at a conference, the team decided that generating 100 new leads through a QR code on a banner would be a success. They set up a landing page with a form and tracked the conversion from scan to form completion. As a result, the QR code was scanned 400 times, of which 120 people left contact information, which gave a 30% conversion rate – the goal was exceeded. With this goal in mind from the very beginning, the team focused on optimizing the form and offer, not just the number of scans.
4. Add UTM Tags to QR Links to Track Sources
UTM tags are special parameters in the URL that help track the source of traffic in analytics systems like Google Analytics. Add UTM tags to the URL that you encode in the QR code. Thus, each scan will be marked as, for example, campaign=QR_summer_sale, medium=print, source=banner. This will allow Google Analytics to see how much traffic and conversions came from your QR code. If you use a dynamic QR service, many of them allow you to set UTM tags directly in the dashboard or even integrate a GA tracking ID for automatic data transfer.
Metric:
Web analytics indicators segmented by your QR source. The main ones are sessions, transitions, new users, conversions, and bounce rate. You can filter all these metrics by the campaign UTM tag. For example, see that the QR code brought 500 sessions, of which 100 were conversions (20% conversion), the average time on page is 1:30 min, and the bounce rate is 10%.
| UTM Parameter | What It Tracks | Example Value | Where to Use It |
|---|---|---|---|
| utm_source | Source of traffic | qr_flyer, qr_packaging | Media/channel where QR appears |
| utm_medium | Type of media | print, email, event | To segment campaign types |
| utm_campaign | Campaign name | spring2025, b2b_launch | To group scans under campaign |
| utm_content | Variant (A/B) | cta_red, cta_blue | To compare performance of variations |
Example:
A museum placed a poster in its lobby with a QR code for downloading a mobile guide. The URL contained the UTM tags source=onsite, medium=QR, campaign=museum_app. A month later, the analysts looked at Google Analytics and saw that 30% of all app downloads came from this QR code (source QR / onsite). They also noticed that users who downloaded the app via the QR code were 20% more likely to open it the next day (higher engagement) than those who downloaded it manually from the store. The UTM tags allowed them to link the code scan to user behavior uniquely, and the museum realized that offline promotion via QR was very effective.
5. Track Different Codes for Different Channels Separately
If your campaign covers multiple channels or locations. For example, print magazines, posters in different cities, mailings. Create a unique QR code for each channel or platform. This can be the same landing page, but with different UTM tags or different codes in the analytics system.
This way, you can compare the effectiveness: which magazine brought more scans, which city interacted the most actively, which version of the creative caused a greater response. In dynamic QR platforms, it is easy to generate and manage dozens of codes. Be sure to use this.
Metric:
The number of scans and conversions for each QR code. Your analytics will show indicators for each placement separately. Pay attention to the conversion rate for different channels. Perhaps there are fewer scans from posters. Still, they are more targeted (higher % of conversions), or vice versa. Such comparisons will help optimize your media plan.
Example:
A university’s marketing team launched a QR code campaign for its master’s programs across multiple channels: one code in printed brochures, another on a billboard near campus, and a third in digital advertising on social media. All three led to the same application page, but had different UTMs. The results showed that the billboard generated 200 scans and 10 applications (5% conversion), the brochures generated 120 scans and 12 applications (10% conversion), and social media generated 300 scans and 9 applications (3% conversion). By separating the codes, the team realized that the highest-quality leads came from the brochures and decided to increase the print run next time and revise the creative for online advertising for higher conversions.
6. Give the QR Codes Meaningful Names and Comments
When you generate a lot of QR codes, it’s easy to get confused about which one is used where. Give each code a meaningful name in the analytics system and add a description (if the platform allows it). For example, name the code “QR_Flyer_NY_2025” or “QR_black_friday_instagram”. This will make it much easier to analyze reports, because instead of a long list of nameless codes, you will see which campaign element means what. This approach is beneficial if you are running multiple campaigns at the same time or have dozens of codes.
Metric:
Quality of your own reporting. Although this is not a classic metric, track the number of QR codes in the campaign and whether they are all displayed correctly in the analytics. Regularly check that the names are not mixed up and that all codes have a signature. The goal is for any team member, looking at the report, to understand what each line of data represents.
Example:
An event agency created ~50 different QR codes for a large conference: registration, program, feedback, sponsor booths, etc. If they had left the default names (like “QR1”, “QR2″…), analysis would have been a nightmare. Instead, they organized the names: “Registration_QR_entrance”, “Agenda_QR_booklet”, “SponsorA_booth_QR”, “Feedback_QR_exit”, etc. When the conference was over, the team quickly analyzed each code: which booth received the most scans, how many people downloaded the app, and how many filled out the feedback questionnaire. Clear organization helped conclude the event an hour after it started, instead of having to figure it out for several days.
7. Use Short URLs for QR codes
The length and complexity of the URL encoded in the QR code affect the density and readability of the code. The shorter the link, the simpler the QR code pattern, and the easier it is to scan. Therefore, before generating the QR code, shorten the URL or use a dynamic code that automatically creates a short redirect. Short and branded URLs also look neater when scanned – some cameras and apps show the URL before the transition, so it is better when the address is clear.
Metric:
Scan rate. This is the ratio between the number of people who saw the QR code and those who scanned it. Although it is difficult to measure this indicator precisely (especially for offline media), a short URL in a QR code contributes to a higher percentage of scans, because the code is read faster and the user sees a clear link. You can indirectly estimate the scan rate, for example, by knowing the circulation of booklets and the number of scans from them. Suppose we have 100 scans out of 1000 booklets distributed, scan rate = 10%. Track this indicator at least approximately to compare different media.
Example:
A food company placed QR codes on packaging, leading to a recipe page. Initially, they encoded direct long URLs like example.com/products/category/seasonal_recipes?id=123. Some buyers complained that the QR code was not always scanned the first time. The company switched to short branded domains for QR (brand.link/fall2025, etc.). As a result, scanning speed improved. Users noted that the camera now recognized the code immediately. While the exact difference is difficult to measure, the team saw that the number of scans per 1,000 package sales increased by about 15% after implementing short URLs.
8. Analyze and Target the Geography of Scans
Track exactly where users scan your QR codes: country, city, and sometimes even specific coordinates. Location data is especially valuable for regional campaigns. Suppose you see that certain cities or states are showing high activity. In that case, it is worth increasing marketing efforts in those areas. Conversely, low indicators in a certain region may signal that your message is less relevant there, or the placement channels were chosen poorly. Hyper-targeting based on such data increases efficiency: you direct your budget to an audience that has already shown interest.
Metric:
Geographic distribution of scans (city/region). Pay attention to both the absolute number of scans in a location and the percentage of the total. It is also useful to take into account the population of the region: 100 scans in a small town can be a cool result, and 100 scans in a metropolis – modest. If the platform builds a map of scans, use it too – the heatmap will immediately show hot spots.
Example:
A national restaurant chain launched a campaign with a QR code on discount flyers sent to different states. Analytics showed that the most scans came from California and Texas, although the flyers were sent evenly across the country. In particular, the city of Austin gave 500 scans, while larger cities like Chicago or Miami gave fewer than 100. Marketers concluded that the offer was best received in the western and southern markets. They promptly redirected part of the budget to additional advertising in California and Texas, and also sent a re-mail to those regions. As a result, the campaign yielded a greater ROI than if they had evenly distributed resources across all states.
9. Track the Times and Days of Scan Activity
When exactly is your audience scanning your codes? Time patterns can tell you a lot about behavior and the context of use. Analyzing scan timestamps will show you at what times of day and days of the week your campaign has peak activity. This is valuable for optimization: you can tie communications to the most active periods. For example, suppose most scans occur on weekends or in the evenings after 7:00 pm. In that case, it is worth posting QR code reminders during these times (for online campaigns) or ensuring that the code is as visible as possible during these hours (for offline campaigns, such as in a restaurant during dinner).
Metric:
Distribution of scans by time. Pay attention to the hours of day and days of the week with the highest scan flow. You can calculate what proportion of scans fall on business hours vs. evenings, weekdays vs. weekends. This way, you will understand when your audience is most likely to interact. This information helps to optimally plan advertising, promotional activities, or even the time of sending materials. As a result, the right timing increases the chances of scanning.
Example:
A utility provider added a QR code to paper bills so that customers could quickly switch to online payments. Data showed that most scans occur between 6:00 pm and 10:00 pm on weekdays, when people return from work and sort through the mail, and on Saturday mornings. Knowing this, the company began sending out payment reminder emails at 6:00 pm on Fridays (hinting “scan the code on your bill for a quick payment”). This coincided with the peak of scans and encouraged people to use the QR code. As a result, the rate of timely payments increased. Defining “peak hours” for scans allowed them to adjust communication to customer behavior.
10. Use Device and OS Data to Optimize Your Content
QR code analytics will usually show you what type of device (smartphone, tablet) and what operating system (Android, iOS) the scan was made from. This data is critical for checking the compatibility of your content. If 80% of your audience scans from an iPhone, you should make sure that your landing page works perfectly in Safari on iOS. If a significant share is Android, check compatibility with popular Android browsers. Also, knowing the devices allows you to adapt your content: for example, showing a “Download in the App Store” button for iOS users, and “On Google Play” for Android. Tracking device models (if the platform allows it) will show how modern the phones of your audience are – whether they support AR filters, complex animations, etc.
Metric:
Distribution of scans by device type and OS. Pay attention to the % of scans from iOS vs Android, as well as desktop vs mobile (sometimes QR codes are scanned from computer screens, although rarely). Another useful indicator is the prevalence of specific browsers (Chrome, Safari), as this will help you test on those browsers that the majority of your audience actually uses. The ultimate goal is to optimize the landing page for top devices and browsers for a flawless user experience.
Example:
A bank placed a QR code in its branch to download a mobile application. After a month of the campaign, the data showed that 90% of scans were from Android devices. When checking, it turned out that the page with the link had a small bug in the Chrome browser on Android (the download button sometimes did not appear). These analytics prompted the team to test the page on popular Android models immediately – and they found and fixed the problem. As a result, the “scan → install application” conversion improved.
Another example: a startup was promoting its web service through QR codes at a conference and saw that a third of the scans were from iPads (people were scanning from the booths using tablets). This prompted them to optimize the page for the large screen of tablets as well, not just smartphones.
11. Consider Audience Language in Scan Data
Some QR platforms (and browsers) report the language installed on the user’s device. This is a useful indicator if your campaign can reach a multilingual audience. The percentage of languages will tell you whether you should localize your content. For example, suppose 15-20% of scans are from Spanish-language devices. In that case, you should add a Spanish version of your page or content to avoid losing this audience. The user’s language actually indicates their language preference in consuming content. And even if your page is currently only in English, you will see hidden demand for other languages.
Metric:
Distribution of scans by language preferences. Track the top 3 languages among scanners. This often correlates with geography, but not always (for example, Spanish speakers may scan in the US, or tourists from different countries scan your code in the West). If one of the languages exceeds ~10% of the audience, this is a strong signal to add support for that language. Also, consider the language of your content: If you notice a significant percentage of foreign-language scanners but can’t localize completely, at least include a summary or key points in that language.
Example:
A consumer electronics manufacturer placed a QR code on their product packaging to access their online user manual. Initially, the manual was only in English. QR code analytics showed that 25% of scans were from phones with Spanish installed, and another 10% were from phones with French installed. The company quickly added a language switcher to the manual page and uploaded PDF versions in Spanish and French. As a result, the percentage of users who spent more than 1 minute on the page increased, and the number of support calls about difficulties understanding the manual decreased. This confirmed that considering the audience’s language improves engagement and customer satisfaction.
12. Track Post-scan Conversions
Scanning the QR code is just an intermediate step. It is important to measure what happens after the user scans the code. A conversion can take many forms: a purchase, a form fill, a subscription, a video watch, etc., depending on your goal. Set up goal or event tracking on the landing page (Google Analytics 4, Pixel, other tools) or use the built-in capabilities of the QR platform, if any (some allow you to track clicks on the page, if it is a micro-landing). For example, if the QR code leads to a landing page with a “Sign Up” button, track the number of clicks on this button and the number of successful registrations. This is the so-called event tracking, which shows how people interact with the page after the scan.
Metric:
Conversion rate and engagement indicators. The main one is the conversion scan → target action (in percentage). It is also useful to know the bounce rate (the percentage of scanned pages that do not interact further), average time on page, and number of pages viewed after scanning (if your QR leads to the site). These metrics will tell you how relevant and user-friendly the content was after scanning. Suppose you see many scans but few conversions. In that case, the problem may be a mismatch of expectations or an inconvenient landing page.
Example:
A technical B2B company at an exhibition handed out flyers with a QR code that led to a registration page for a free demo product. They set up a goal in Google Analytics to fill out the “Request a Demo” form. According to the results of the exhibition, there were ~300 scans, but only 30 requests for a demo, i.e., a conversion of ~10%. The team analyzed the behavior: most scanners spent less than 5 seconds on the landing page and did not interact, resulting in a high bounce rate. This signaled that the page was either not interesting or was inconvenient for mobile. They optimized the page, made a shorter description, a larger button, and removed unnecessary form fields. At the next event, the scan → application conversion increased to 25%. Measuring post-scan actions pointed out problems that would otherwise have gone unnoticed.
13. A/B Test QR Code Designs and Placement
Don’t be afraid to experiment with different QR code variations and their use, and compare the results. A/B testing for QR codes can mean: two different code designs (colors, frames, “Scan me” call-to-action), two different positions on the page, different accompanying text, or even two different offers for individual codes. Run both variants in parallel, dividing the audience, and collect analytics. As a result, one variant, as a rule, will show the best result – it is worth using it in the future. Thanks to QR analytics, you will know exactly which of the two approaches worked more effectively (for example, a bright green QR with the inscription “Get a discount -10%” can collect more scans than a black and white one without text). A/B testing allows you to take a scientific approach to campaign optimization, rather than relying on assumptions.
Metric:
Comparison of key indicators between variants. For a design or text test, the main metric is usually the number of scans of each variant (which one attracted more people). If you are testing different landing pages or offers using different QR codes, then look at the conversion and time on page for each. It is important to have a sufficient sample size: at least 100-200 scans per variant to conclude.
Example:
A retailer wanted to find out which call to action would better encourage people to scan a code from a store window. They placed two posters next to each other: on one, next to the QR code, the text “Scan and win a prize!”, on the other, “15% discount! Find out how by scanning”. The codes are different, but they lead to the same landing page. In a week, the poster with a mention of the discount received 250 scans, while the variant with a prize received only 90 scans. Analytics confirmed that the discount was a stronger incentive.
| Variant | Design Description | Total Scans | Conversion Rate | Winner? |
|---|---|---|---|---|
| A | Blue QR + “Scan & Save” | 840 | 7.2% | ✅ |
| B | Black QR + no CTA | 510 | 3.8% | ❌ |
The store removed the second option and replicated the first in other locations, knowing with confidence that it worked. Similarly, online marketers can test two banners with different QR codes (e.g., different colors or different bonuses) and see which one brings in more traffic or a better scan → action CTR.
14. Test and Improve User Experience
The effectiveness of a QR campaign depends not only on the code itself, but also on the user experience when scanning. Make sure you test the path from scanning to completing the target action. The QR code should be easy to scan on different phones, quickly open the content, and the content itself should be adapted to mobile devices (responsive design, fast loading, clear interface).
Test the QR code on different devices: iOS, Android, older models, from different distances, to see if it is printing. Check if there are any problems with scanning (glare, size, colors) and whether the page is displayed correctly. Also, imagine the user journey: is it clear to them what to do after scanning? Does the content meet their expectations created by the ad? Eliminate friction; otherwise, all other metrics will be meaningless if people drop out immediately after scanning.
Metric:
Bounce rate and time to interaction. In analytics, pay attention to the bounce rate – if it is high, you need to look for the reason in UX. You can also measure the time from scan to first event (e.g., click). If users do nothing for a long time, the page may be confusing. Another indirect indicator is scan speed: conduct your own small test with a few people, and see how many seconds it takes to find and scan the code on your material. This will help you assess the convenience of the code placement and design.
Example:
A company that advertised a new car gadget through posters with a QR code noticed that although there were enough scans, the conversion to sales was low. The analysis showed that 80% of scanners left the page in less than 5 seconds. It’s a very high bounce rate. It turned out that the landing page was too “heavy”: high-resolution video took a long time to load, and the layout was slow on mobile phones. After fixing these problems (they made the page easier for mobile, put a preview instead of an automatic video), the company saw that the time on the page increased. The conversion to purchase rose from 1% to 3%.
Lesson: Even the best analytics won’t help if you don’t take care of the user’s comfort after scanning.
15. Be Privacy and Legal
When tracking QR codes, it’s important to keep your users’ privacy in mind. The data you collect (location, device, time) is typically anonymous and non-personally identifiable. It’s only needed for aggregate statistics. In most cases, you don’t need to specifically consent to such tracking, as it’s similar to how websites track visits.
However, if you plan to do more in-depth tracking, such as linking scans to a specific person, collecting contact information via QR, or using cookies/pixels for remarketing. You need to notify users and obtain the necessary consent. Be sure to read and comply with local laws (GDPR in Europe, CCPA in California, etc.).
It’s a good idea to include a privacy statement or tooltip next to the QR code that you’re analyzing scans. Also, upon request, the user should be allowed to opt out of further tracking, if relevant (for example, not recording their actions or not sending promotions after a scan).
Metric:
No incidents and audience trust. Here, success is measured by the fact that you do not receive complaints or privacy violations. Keep an eye on the percentage of people who opted out of tracking (if you provide such an option) – if it is high, it may be worth simplifying data collection to purely anonymous. Audience trust is difficult to quantify, but critically important: if people feel that you are transparent and responsible with data, they will be more willing to scan your QR codes and move on to the next stages of interaction.
Example:
A fintech startup used QR codes to register new customers with a bonus. When scanning, the user was taken to a form where they had to enter personal data. The company added a short message: “By scanning the code, you agree to the processing of data to activate the bonus. We do not share your data with third parties.” This ensured transparency. There were no complaints about unexpected information collection. On the contrary, users appreciated that they were openly informed how their data would be used.
The startup also made sure that all the scan analytics they saw (city, time, device) were anonymized. That is, they did not contain names or contacts without voluntarily filling out the form. Compliance with privacy principles not only protected the company from legal risks but also increased the loyalty of new customers.
Key Metrics to Monitor
Once you’ve set up QR campaign tracking, it’s important to know what metrics to track. Below are the key metrics and an explanation of what they mean and how to put them into practice:
| Metric | What It Shows | How to Use It |
|---|---|---|
| Total Scans | The number of times your QR code has been scanned. This figure reflects the overall engagement of your audience, the total number of interactions with the code. | Measure the popularity of the campaign. If scans are low, consider redesigning or repositioning the code. Use it as a baseline metric for ROI (e.g., cost per scan). |
| Unique Scans | The number of individual users or devices that scanned the code (repeated scans not counted). Shows audience reach, how many separate people were interested. | Evaluate the true reach of your campaign. Comparing it with total scans gives a ratio of repeat interactions. |
| Scan Location (Country/City) | The geographical distribution of scans. For example, how many scans by country, region, or city. Helps identify areas with the highest interest. | Focus your marketing efforts on strong regions. For weaker areas, investigate the cause (poor visibility, low relevance) and adjust accordingly. |
| Time of Scan | Scans were distributed by hours of the day, days of the week, or specific dates. Shows when your audience is most engaged. | Optimize communication timing: run ads, publish content, or send emails just before peak activity hours. |
| Device & OS | The types of devices (phone, tablet) and operating systems used to scan. Indicates your audience’s technical preferences. | Ensure your content is compatible with the most used devices. For example, if 70% of scans are from iPhones, test and optimize for iOS. |
| User Language | The language settings of devices used to scan. Shows what language your audience prefers for content consumption. | Add multilingual support if more than 10% of scans come from non-primary languages. This boosts trust and conversion. |
| Referral Source | The context in which the code was scanned (e.g., print, email, social media). Indicates where your audience is coming from. | Analyze which channels work best and adjust your QR code placement accordingly. |
| Conversion / Target Action | The number and percentage of users who completed a desired action after scanning (e.g., purchase, registration). Measures the effectiveness of your campaign. | Assess ROI. Compare it with other channels. If conversion is low, optimize your landing page or offer. |
How To Optimize Your Campaign Based On Analytics
Gathering data is just the first step. The main thing is to draw the correct conclusions and improve your campaign based on the information you receive. Here are some tips on how to act with QR campaign analytics:
- Reallocate resources to successful channels: Analyze which QR codes/channels have yielded the best results. If, say, a QR code in a magazine ad brought three times more leads than a QR on a billboard, direct more budget to the magazine channel next time, or increase your presence in that magazine. Optimize your media mix by investing where the CPL (cost per lead) through QR is lowest.
- Increase reach in active regions: If analytics show that certain cities or areas are responding particularly well (high scan and conversion rates), concentrate your marketing efforts on those regions. For example, add local promotions, more advertising, or physical QR codes there. This will allow you to get the maximum effect in areas where data already confirm the audience response.
- Adjust the timing of promotions: Use scan time data to plan your actions. For example, if you see that the peak of scans falls on 7-9 pm on weekdays, you can launch flash mailings or ads shortly before this time, reminding people about the QR code. Or if there are few scans on weekends, perhaps you should focus the campaign on weekdays and not spend effort on weekends, or vice versa. Come up with an additional incentive on the weekend. Data on peak hours helps to maximize the visibility of the QR code when the audience is ready to scan. Personalize content for the audience: Analyzing devices, languages, and other characteristics of the audience allows you to fine-tune your message. If a significant part of the audience is Android users, make sure they are welcomed with a “Get it on Google Play” button or materials in the style of Material Design. If you see a lot of Spanish-speaking users, add at least a short message in Spanish or a bilingual approach. Personal touch increases conversion because the user feels: “Oh, this was made just for me.” Analytics data actually tells you which part of the audience needs a separate approach (language, technical, or content).
- Improve or change weak links: Look for where the funnel fails. For example, many scans, but few conversions → a problem with the landing page or with the offer. Many page views, but few clicks on the CTA → perhaps the CTA is unclear or unattractive. Low number of scans in general → either low traffic to the code location, or the design/CTA code is inconspicuous. The data will help identify the stage where the churn is the highest, and you can work on it specifically. For example, if you see that many are scanning but not registering, simplify the registration form or improve the value proposition on the landing page.
- Re-test and iteratively refine: Optimization is a continuous process. After making changes (new design, changed text, another channel), run the campaign again and carefully look at the analytics. Have the metrics you need improved? For example, you noticed that Monday was a weak day and launched a special email campaign “QR code is valid only today, don’t miss it”. Assess whether the scans this Monday jumped compared to the previous one. If so, great, consolidate the success. If not, try a different approach. Gradually, through the cycles of analysis → action → analysis, you will bring your QR campaigns to maximum efficiency.
- Document insights and share with the team: Don’t store the knowledge gained only in the analytical system. Write down the conclusions after each campaign: which metrics achieved the goals, what worked, and what didn’t. Conduct short presentations or reports for the team and management, showing the results (for example: “QR code brought 20% of all leads at this exhibition, conversion 15%, the most scans on the first day of the event 40%”). This not only solidifies your expertise but also helps other departments in the company apply this knowledge. In subsequent campaigns, you can build on the already proven data, avoiding repeating mistakes and using best practices.
Final Thoughts
Remember, numbers alone won’t change anything unless you act on them. Successful B2B marketers use QR code analytics as real-time feedback from their audience, and flexibly adjust their strategy, getting better and better results.
Frequently Asked Questions
Can QR codes track campaign UTM tags?
A QR code itself doesn’t contain any special analytics. It simply transmits the URL encoded in it. But if you embed UTM tags in the URL, then when scanned, these tags will be passed on to your web analytics system. In practice, this means that dynamic QR codes can quite “transport” UTM tags to Google Analytics or another platform. For example, the URL https://example.com/page?utm_source=QR&utm_medium=poster&utm_campaign=fall2025 will send the user to the page after scanning, and GA will record the source as QR/poster (campaign fall2025). Some QR platforms even allow you to enter UTM parameters when creating the code, so you don’t forget to add them. This way, you will see traffic and conversions from the QR campaign on par with other channels. This is very convenient for reporting – you can demonstrate that, say, QR codes brought 500 visitors and 50 applications, and compare it with the results of email or social networks. So, the answer is: yes, using UTM tags is standard practice when tracking the effectiveness of QR codes through analytics systems.
Do you need user consent to track QR code scans?
In most cases, no, separate consent is not required, because the data collected by QR analytics is usually general statistics without personal information (number of scans, time, city, device type, etc.). This does not go beyond what regular websites collect (IP address log, time of visit). However, it is important to comply with privacy laws. Suppose you start collecting personal data (name, contact, or even set cookies for advertising) during the scanning process. In that case, you need to inform the user and obtain consent, as you would do on the site. For example, suppose a QR code leads to a page with a registration form. In that case, the very fact of filling out the form is already a consent to the processing of that data. Still, you must provide the user with information about what this data is for (usually through a privacy policy). Suppose we are talking about purely aggregated scan data. In that case, it is enough to adhere to the principles of transparency and data minimization: collect only what is needed (and what you analyze), store this data in a secure form, and do not transfer it to third parties unnecessarily. Most modern platforms (including ViralQR) already follow these norms by default, providing you with depersonalized analytics. So, to summarize: regular QR code tracking does not require separate consent, but if you go beyond anonymous statistics, be sure to act in accordance with the requirements of GDPR/CCPA and inform users. Transparency in data handling will increase audience trust and protect against legal risks.
How many QR codes can you track at once?
Most platforms, including ViralQR, allow you to create and track hundreds or even thousands of codes at once. You can organize them into folders, add tags, and campaign groups. This is convenient for large marketing initiatives, events, or branched brands. It is important to give each code a clear name for navigation.
Can I see who exactly scanned the QR code?
No, you cannot identify the scanner without their active action (for example, if they leave a contact, fill out a form, or log in). QR code analytics data is usually anonymous. You see aggregated information: time, device, geo, but not a specific person.
How to know if a QR code is not working well?
If you see a low number of scans compared to your reach or circulation, it could indicate problems: poorly visible code, incorrect placement, lack of motivation (“why scan?”), or a bad CTA. The solution is to test alternative options, A/B design, make the code larger, change colors, and add “Scan Me” text.
Can QR codes lead to pages with Facebook or Google pixels?
Yes. You can lead users to a landing page where Facebook Pixel or GA4-Tracking is already installed. This way, even if the QR code only carries an anonymous transition, after scanning, the user falls under your remarketing or custom audience in Meta, Google Ads, TikTok Ads, etc.